NETS Project
This page contains information about the NETS (National Establishment Time Series) Project.
Overview
The National Establishment Time Series (NETS) Database tracks information of over 87.5 million businesses between 1990 and 2022. Data provided in the NETS Database includes active years of business, industry, number of employees, and sales. The Rose Institute seeks to leverage this database in order to track the economy over time and responses to particular policies or events, on a national, state, and local level. Below are visualizations made by the NETS team to demonstrate the capabilities and proposed use cases of this database.
Business Movement Data
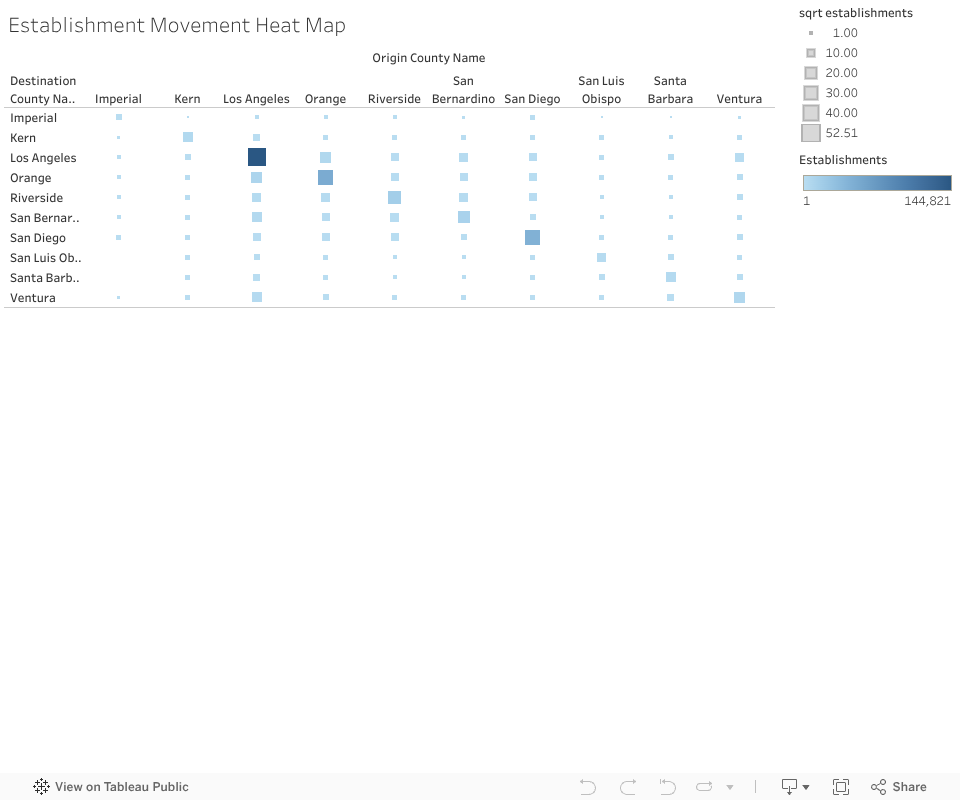
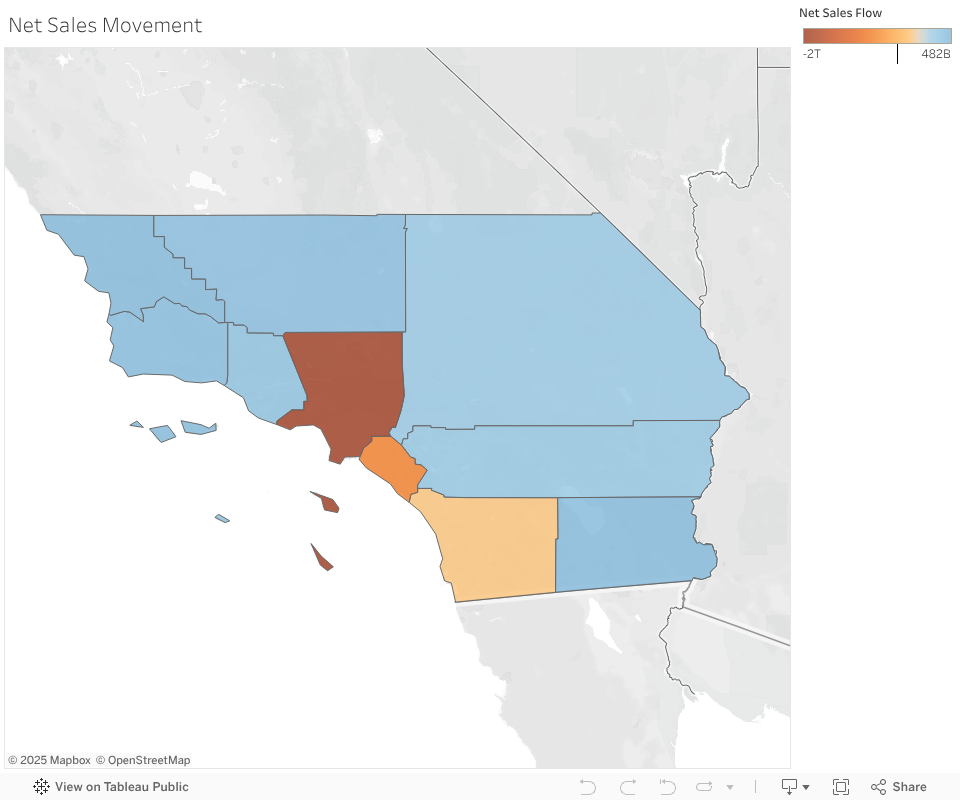
The following three visualizations outline the movement of businesses within Southern California between the years of 2005-2021. The heatmap indicates the originating and terminating counties of businesses that relocated within SoCal. The two geographic maps detail the net flow of businesses and sales respectively organized by county, summed across the timeframe.

Psychiatric and Substance Abuse Hospitals Data
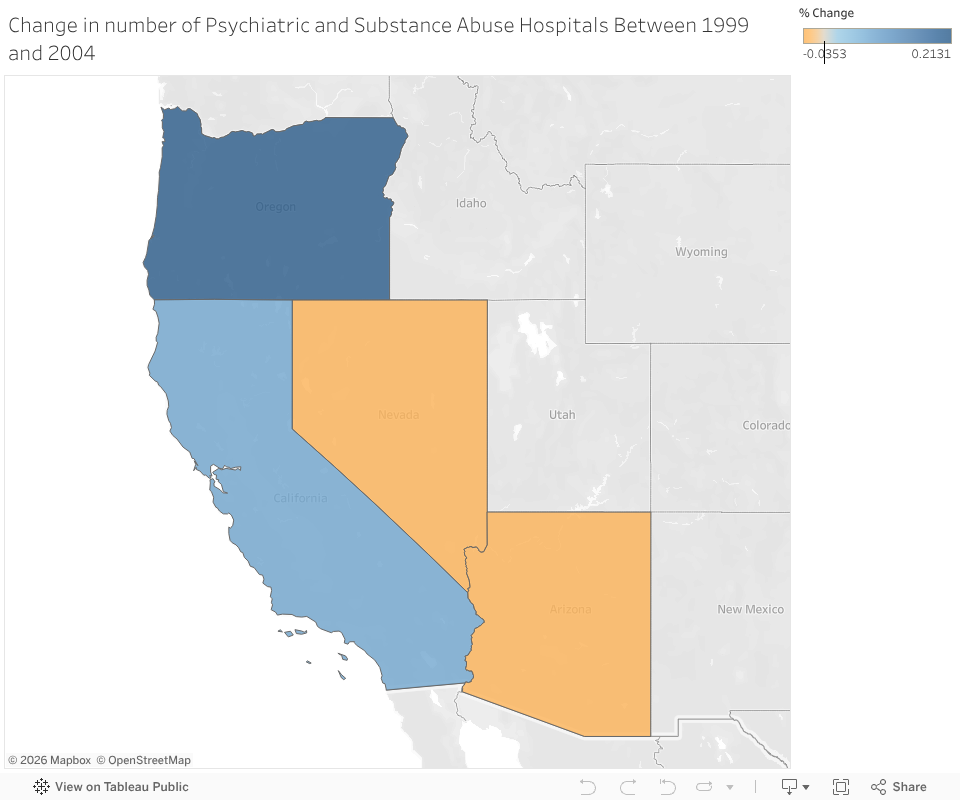
The following geographic map details the net change in the number of Psychiatric and Substance Abuse Hospitals in California and surrounding states between the years of 1999-2004. Two of these states, California in 1999 and Oregon in 2003, through AB 88 and SB 267 respectively, increased state investment into these institutions, while the other two, Nevada and Arizona, saw no dramatic policy changes targeting these institutions in the timeframe.
Resources
Additional resources and documentation for the NETS Project will be listed here.